Build a dashboard in qtrl.me with sensors, switches, dimmers, blinds and the electricity price, in panels with colors and icons that change with the value.
The dashboard is your own home page. Here you gather temperatures, switches, dimmers, blinds, the electricity price and anything else you want to see, and it works on both computer and phone. You build it from widgets that you place in panels. Everything is saved automatically as you work.
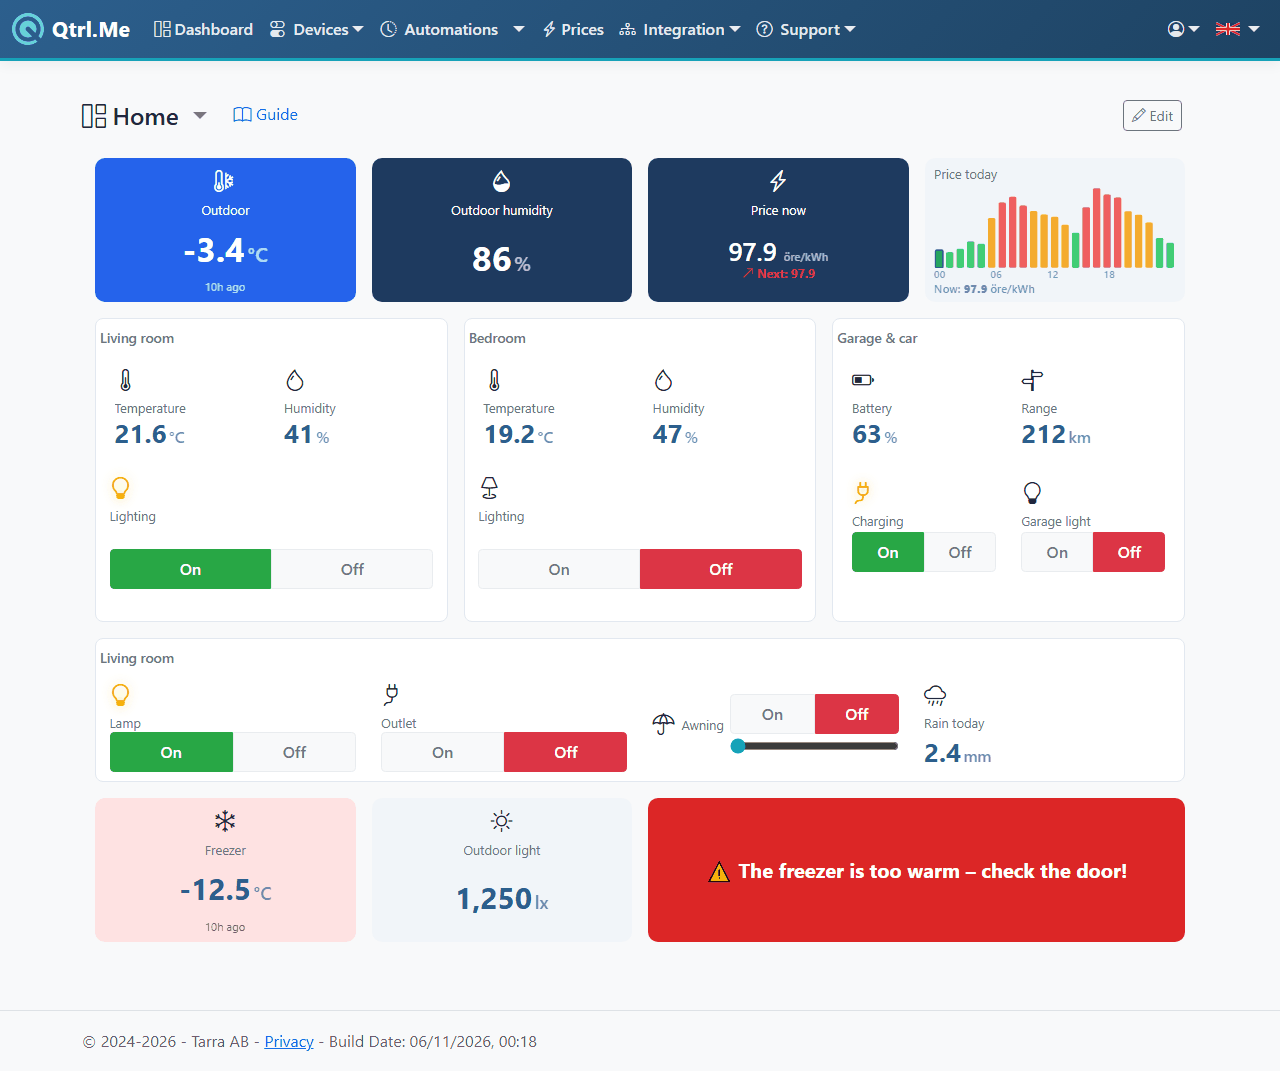
View and control
Outside edit mode you use the dashboard as normal:
- Switches have on/off buttons. By default they are split into On and Off, as on the Devices page; see Show as below for the other looks.
- Dimmers have an on/off button that shows the level in percent and a slider from 0 to 100%.
- Blinds, roller blinds and shutters have up, stop and down buttons.
- Sensors show their latest value with a unit, for example 21.4 °C or 63%.
- Electricity price shows the price in öre/kWh including VAT (more below).
Values update instantly when a sensor reports in or someone else controls a device. You don't need to reload the page.
Edit
- Go to Dashboard in the menu.
- Click Edit. The Add widget and Add panel buttons appear, and every widget and panel gets its own tools.
- Add, move and change whatever you like.
- Click Done when you're happy with it.
Every change is saved immediately, and Saved appears next to the buttons. If you add #edit to the end of the address, the page opens straight into edit mode.
In edit mode the buttons and controls are switched off, so you can move things around without accidentally turning something on or off.
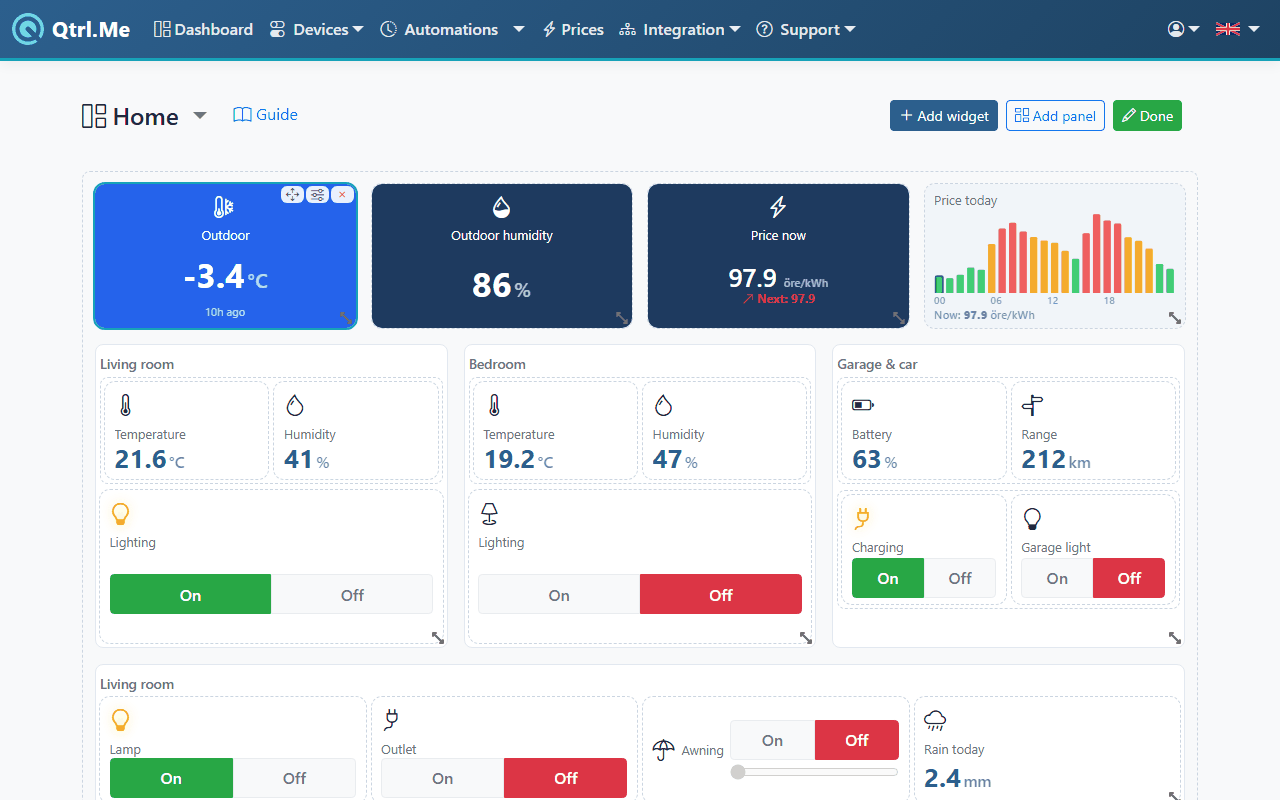
Select, move and delete
Click a widget or panel to select it. The selected one shows three tools:
- The drag handle (the four-way arrow): hold and drag to move it. You can move within a panel and to another panel. Drop it on the top half of another widget and it goes before it; on the bottom half it goes after. In a horizontal stack, the left and right halves apply instead.
- The sliders icon: opens Properties (see below).
- The cross: removes the widget or panel along with everything in it.
In a grid you move widgets by dragging them and resize them by dragging the corner. They stay where you drop them, even if that leaves gaps.
New widgets and panels land in the panel you have selected. If you've selected a widget, they land in the same panel as that widget. If nothing is selected, they land in the base panel.
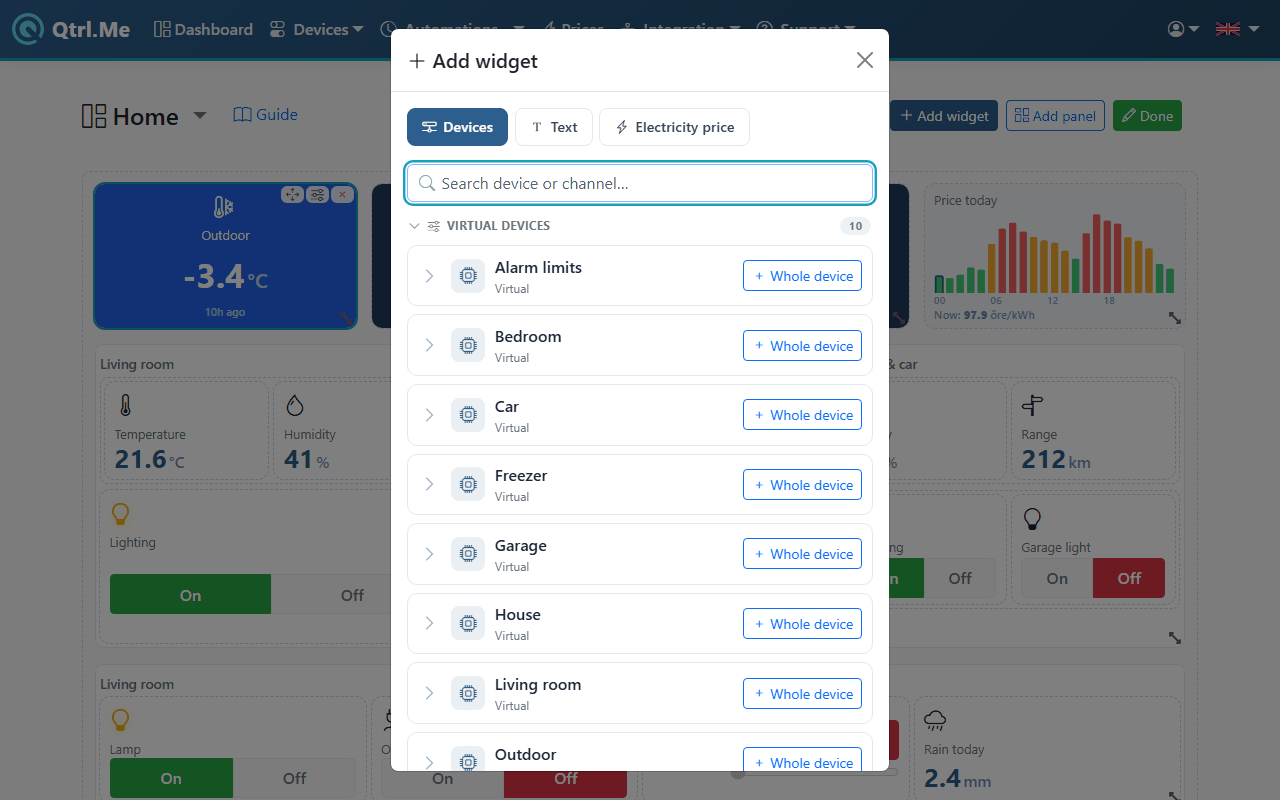
Add widget opens a picker with three tabs:
Devices
All your devices are listed under the hub or connection they belong to, with each device's channels underneath. If you have several hubs you can collapse them. Type in the search box to filter by device or channel name.
- Click a channel to add just that one, for example the temperature from a sensor or the relay in a Shelly.
- Click Whole device to add all channels at once. They land in a vertical stack with the device's name as the heading.
Hidden devices don't show up in the list. That applies to RF devices, Shelly and other cloud-connected devices, and your virtual devices, which sit under Hub 0.
Text
A heading or short text, for example Conservatory or Kids' room. Type the text and click Add text.
Electricity price
Choose a price zone, for example SE3 for Stockholm, and what to show:
| Mode |
Shows |
| Current price |
The price right now. |
| Current + next |
The price now and for the next period, with an arrow showing whether it's getting more expensive (▲), cheaper (▼) or staying the same (→). |
| Daily chart |
Today's price as a graph with a marker for now, plus the current price. |
| Min/max/avg |
Today's lowest, highest and average price. |
Prices are in öre/kWh (1/100 SEK per kWh) including 25% VAT, without grid fees or markups, and update every five minutes. Read more in the electricity price guide.
Panels
A panel is a container for widgets and other panels. Add panel offers three types:
- Grid (free placement): you place widgets freely and decide their size. Good for an overview with large and small tiles.
- Vertical stack: widgets one above the other. Good for a list, for example all your rooms.
- Horizontal stack: widgets side by side. Good for a row of key figures.
Give the panel a title (optional) if you want a heading above it. Panels can contain other panels, for example a horizontal stack with one grid per floor.
The whole dashboard sits inside a base panel that can't be deleted. The cross on the base panel instead clears the whole dashboard, and you're asked before anything disappears. You can change the type of any panel, including the base panel, under Properties.
Properties
Select a widget or panel and click the sliders icon to open Properties.
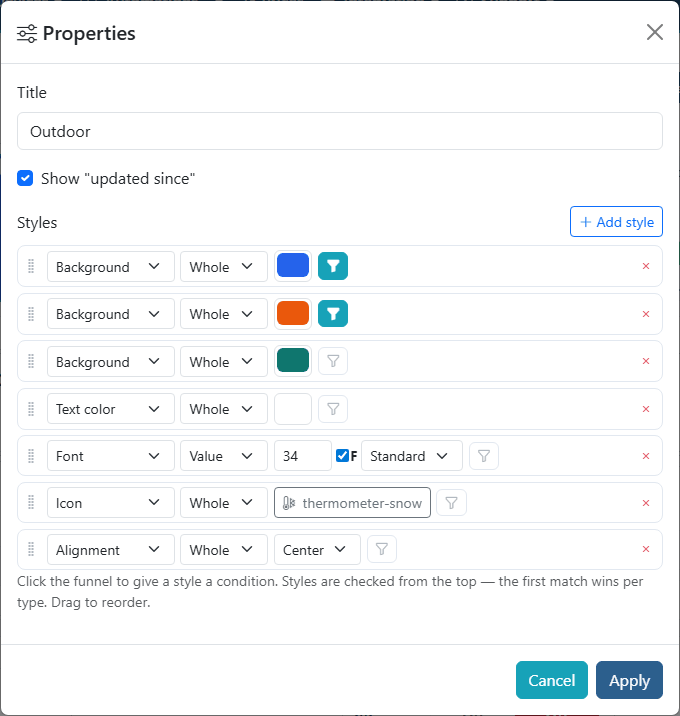
For all widgets and panels:
- Title: the text at the top. Leave it blank to not show one.
For a channel:
- Show "updated since": shows under the value how long ago it came in, for example just now or 5m ago. Good for sensors that report rarely.
- Show as (switches and dimmers only): how the on/off control looks. Buttons (On and Off side by side, the same as on the Devices page), Switch (a small slide switch), Toggle (a single button that switches), Icon (a round button with the widget's icon that lights up when on), Whole tile (the whole widget is the button and fills with the on colour) or Status only (no button, just On/Off with a coloured dot). Inherit takes the panel's choice, otherwise the device's own setting, otherwise Buttons.
For a stack (vertical or horizontal):
- Panel type: switch between grid, vertical and horizontal stack.
- Distribute content evenly: all widgets get the same size.
- Compact list (vertical panels only): one row per device, name on the left and value or button on the right. Works well on phones.
- Height (px), if the panel should have a fixed height.
- Gap (px) between widgets (default 8).
For a grid:
- Columns (2–20): how many columns the grid is divided into (default 12).
- Cell margin (px): the spacing between cells (default 8).
- Row height (px): the height of a row (default 90).
- Row count: shown instead of row height when the grid sits inside another grid, and sets how many rows it fills.
Every panel also has Tiles in the panel show as, the same choices as Show as, for all switches and dimmers in it that don't choose for themselves.
Click Apply to save the changes.
Styles
Under Styles you change the appearance. Click Add style and choose a type:
| Style |
What it does |
| Background |
Background color. |
| Text color |
Color of the text. |
| Font |
Size in pixels, bold (F) and font: standard, serif, mono or sans. |
| Border |
The border's width in pixels and color. |
| Margin |
Space outside the widget, in pixels. |
| Padding |
Space inside the widget, in pixels. |
| Alignment |
Left, center or right. |
| Visible |
Show or hide the widget. |
| Icon |
An icon in front of the value. Click Choose icon… and search (for example lamp, thermometer, door). With no search words you get suggestions for the home. |
| Button |
The colours of on/off buttons. On and Off: tick and pick a colour. Anything left unticked is inherited from the panel. The default is green and red. How the button looks is chosen with Show as (see Properties above). |
Each style applies to the Whole widget, just the Title, or just the Value. Choose that in the dropdown on the row. For example, you can make the value large and bold while keeping the title small.
A style on a panel is inherited by everything in it. That applies to font, text color, alignment, the Button style, including panels inside the panel. A style aimed at Value or Title on a panel, such as a background, lands on every value or title in the panel. If you set a white text color on a panel, every widget in it turns white too, unless it has its own text color. Set the style on the dashboard's outermost panel and it applies to the whole dashboard.
Conditions: colors that change based on the value
Every style can have a condition. The style then only applies when the condition is true. Click the funnel icon on the style's row. A filled-in funnel means the style has a condition, and hovering over it shows the condition.
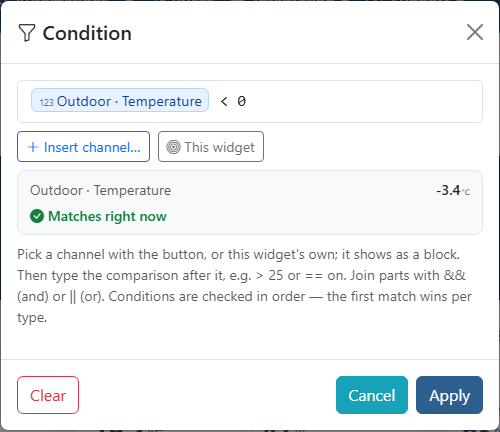
- Click Insert channel… and search for the channel. It's added as a block with the device and channel name. To use the widget's own channel, click This widget.
- Type the comparison after the block, for example
> 25.
- Below the field you see the channel's current value and whether the condition is true right now, so you know what to compare with.
- Click Apply.
For a lamp or socket there are the shortcuts Widget is on and Widget is off, and for a door or window sensor Widget is open and Widget is closed. They fill in the whole condition for you. For example, add a yellow background with the condition Widget is on and you can see at a glance which lamps are lit.
Examples (bold is a channel block):
| Condition |
True when |
Outdoor · Temperature > 25 |
it's warmer than 25 degrees outside. |
Outdoor · Temperature < 0 |
it's below zero. |
Garage · Light == on |
the light is on. |
Bedroom · Temperature > 20 && Bedroom · Temperature < 24 |
the temperature is between 20 and 24. |
Kitchen · Light == on \|\| Hall · Light == on |
either of two lights is on. |
! Garage · Light |
the light is off. |
You can use:
- Channel blocks for the channel's value. If it's compared with a number, it's treated as a number, and the unit (°C, %) is ignored. (Behind the block,
state(id) is stored, where id is the channel's number. If you type or paste state(id) yourself, it also becomes a block.)
num(id) for the value as a number, for example for a difference between two sensors. It's shown as a block marked 123.- Numbers, text in single quotes (
'on') and true/false.
- Comparisons
> < >= <= == !=, the operators + - * /, && (and), || (or), ! (not) and parentheses.
A condition without a comparison is true when the value exists and isn't 0, off or false.
Order matters
Styles are read from top to bottom. For each combination of type and target, the first style whose condition is true, or that has no condition, wins. Drag the rows to reorder them.
Example of a temperature that changes color:
- Background red, condition Outdoor · Temperature
> 25
- Background blue, condition Outdoor · Temperature
< 18
- Background green, no condition
Above 25 degrees it turns red, below 18 blue, and otherwise green. If the green row came first, the widget would always be green.
With Visible: Hide and a condition, you can make a widget show only when it's needed, for example a warning when the freezer gets too warm. Hidden widgets aren't visible when you look at the dashboard, but in edit mode they're shown dimmed so you can find and change them.
Multiple dashboards
The dashboard's name at the top is also a menu. Click the name to see all your dashboards and switch to another one. The star marks your default dashboard, the one that opens when you go to Dashboard.
Below the list, the same menu has:
- New dashboard: give it a name and click Apply.
- Rename the dashboard you have open.
- Set as default, shown when the one you have open isn't already the default.
- Delete. You're asked before it disappears. Your last dashboard can't be deleted. If you delete the default dashboard, the next one in the list becomes the default.
At the bottom of the menu you can see how many dashboards you have and how many your tier allows.
Limits by tier
How many dashboards and widgets you can have depends on your tier:
| Tier |
Dashboards |
Widgets per dashboard |
| Free |
1 |
10 |
| Plus |
3 |
50 |
| Premium |
10 |
500 |
| Pro |
20 |
1000 |
Text, electricity price and channels count as widgets; panels don't. Your limit is shown at the bottom of the dashboard menu.
If you move to a lower tier, nothing disappears. Widgets beyond the limit are shown with a padlock and no value, and dashboards beyond the limit are shown with a padlock in the dashboard menu. Delete what you don't need (the cross on a locked dashboard in the menu deletes it), or upgrade again, and they're unlocked.
Example
The overview at the top of the page is a grid with twelve columns. The outdoor temperature changes color based on conditions: blue below 0 degrees, orange above 25, and teal otherwise. The rooms are vertical stacks with a horizontal stack for temperature and humidity, and the freezer warning only shows when the freezer is warmer than −15 degrees.
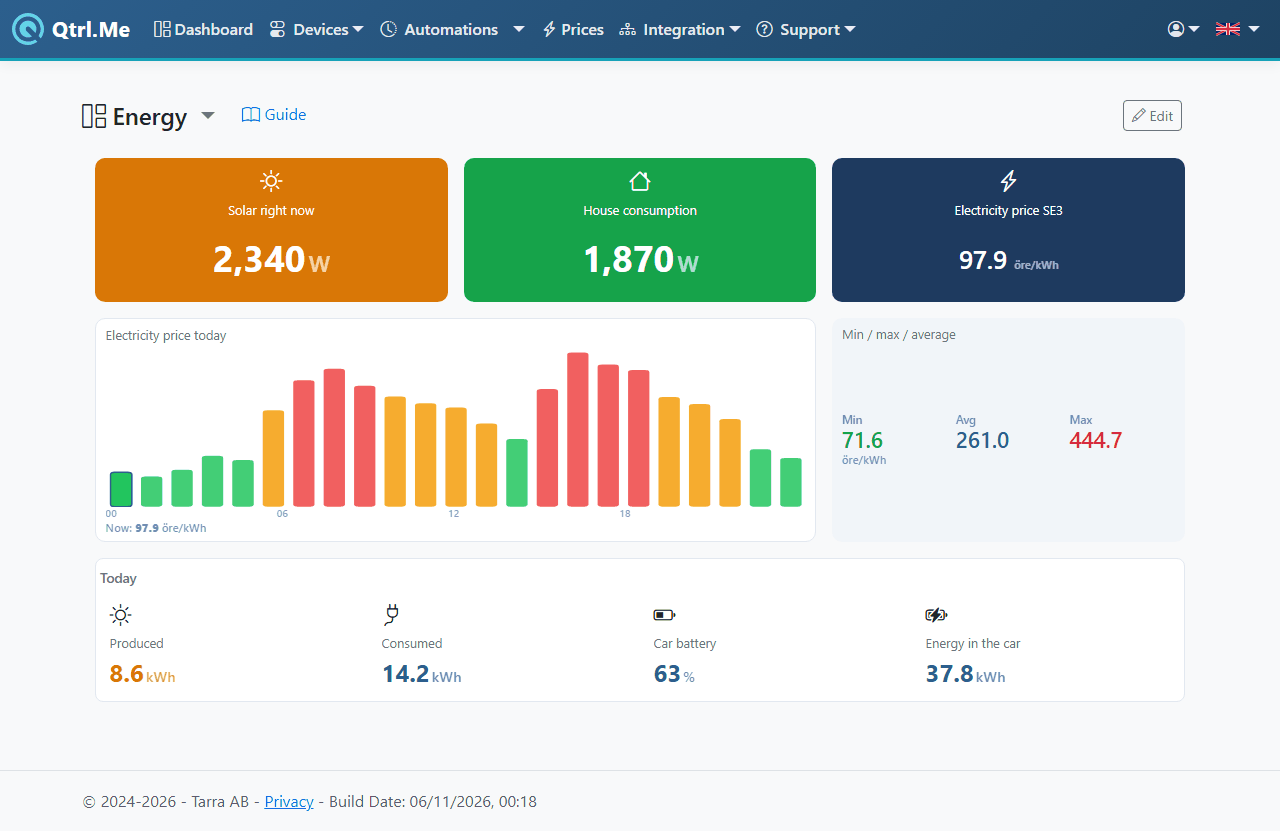
An energy overview with solar panels, consumption and the electricity price. Consumption turns red when the house is drawing more than the solar panels produce, with the condition num(consumption) > num(solar panels), where the names stand for the two channel blocks:
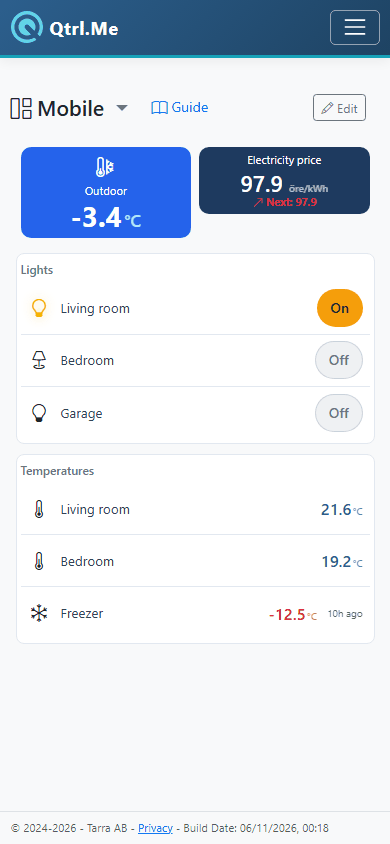
A dashboard for the phone, built as a vertical stack:
Good to know
- It's a good idea to build the dashboard on your computer and use it on your phone. On a narrow screen a vertical stack works best, and a horizontal stack with many widgets gets cramped.
- If you rename a device or channel under Devices, the new name shows up in the picker. A widget keeps its own title until you change it under Properties.
- If you remove a device, its widgets just show a dash. Remove them whenever it suits you.